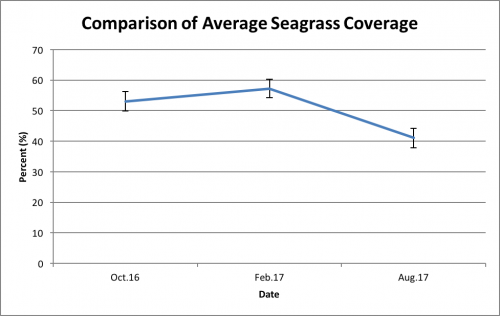
While leading and participating in regular surveys for turtle nest checks, tortoise measurements, mangrove abundance, and beach cleans, I also completed a project of my own focusing on the percentage of sea grass coverage and sea urchin density on Anse St. Jose in front of our base. Within the last year, there were two other interns that assessed these abundances in October 2016 and February 2017. Since data has only been collected a few times so far, it is difficult to determine trends and analyze the reasons for decreases and increases of densities.
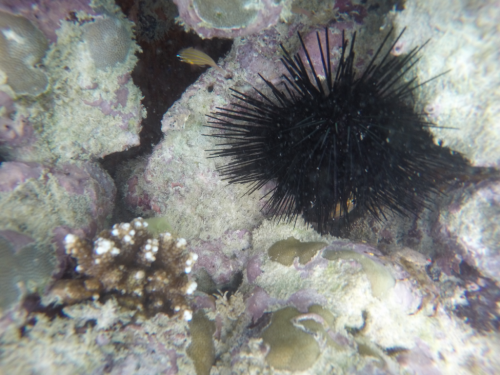
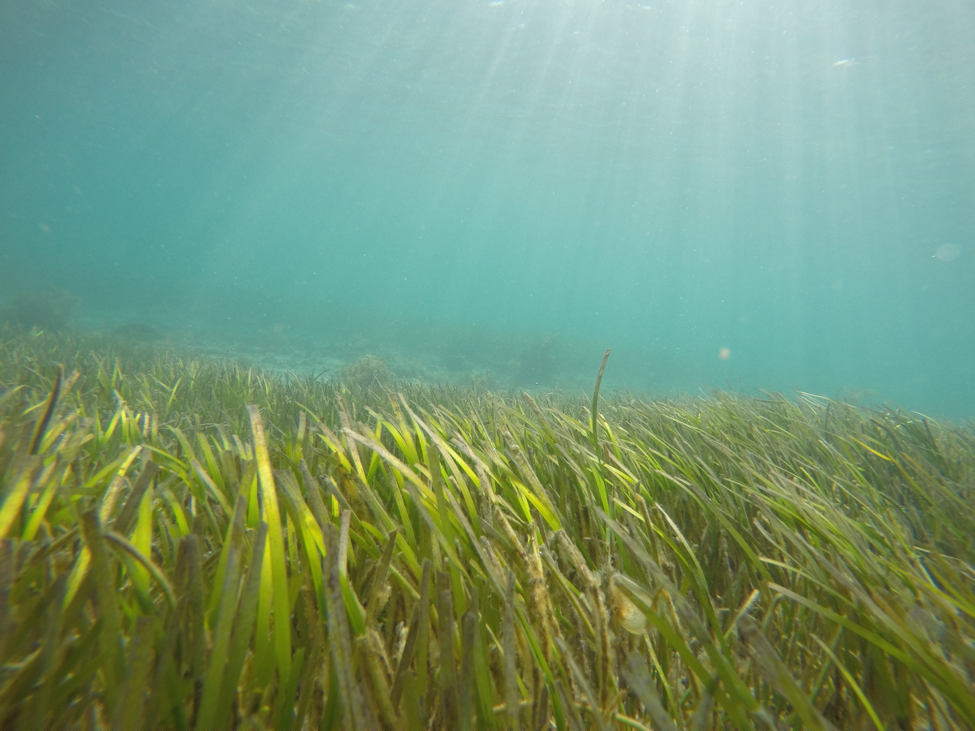
Sea grass is extremely important to the ecosystem on Curieuse, serving as food for animals such as shrimp, sea turtles, and snappers, nurseries, and sources of protection and camouflage. Sea grass also acts as a filter for nutrients and sedimentation in the ocean. Sea urchins can alter the diversity and densities of plants and animals through selective feeding. During the coral bleaching last year, there was an increase in urchin populations seen around the effected coral sites. GVI would like to continue monitoring the urchins to see if there is a relation to the bleaching, studying whether an increase in urchins signals coral bleaching or a decrease in urchins signals coral restoration.
To collect my data, I had four 50 meter transect lines, a quadrat (1mx1m) divided into 16 squares, a writing slate, and camera. Each transect line was 33.3m apart. At every other meter marker to the right of the line, the quadrat was placed on the sea floor and photographed. The writing slate also was photographed to keep track of meter markers. This was repeated until the end of the line for each of the four. On the way back, short spine sea urchins were recorded within one meter to the right or left of the transect line. The quadrat was used to determine whether a sea urchin was in bounds or not. Photographs were analyzed. For each picture of the quadrat, each square of the grid was given a percent coverage. All of the 16 smaller sections were added to give that particular quadrat’s sea grass percent coverage. The average sea grass coverage for the four transects was 41.05927%. This was a 16.1712% decrease since February 2017. The sea urchin density was the same as it was in February at 0.135 urchins per square meter, or an average of 13.5 per transect.

Decreases in sea grass coverage can be related to several natural and human factors. Changes in weather, tide height, and ocean temperature can cause decreases in abundance. When the water is foggy and sediment is stirred up, the sea grass cannot obtain oxygen normally from the sun rays and can suffocate. Tourists standing on sea grass and boat propellers in the shallow waters may also cause damages. However, decreases in sea grass abundance can be caused by an increase in species feeding on sea grass, causing only temporary decreases.
Several challenges were and could be faced during data collection and analysis. Weather conditions can affect visibility making photo analysis difficult. Currents can also alter the transect line, differing from the placement of the previous projects. Additionally, photographs of the quadrat and sea grass percentages may be interpreted differently through the intern projects.